 REV-INR: Regularized Evidential Implicit Neural Representation for Uncertainty-Aware Volume Visualization
S. Saklani, T. M. Athawale, N. Pal, D. Pugmire, C. R. Johnson, and S. Dutta
[Preprint (arXiv)] [BibTex] [Presentation slides]
(IEEE PacificVis 2026 Proceedings, Sydney, Australia)
Abstract
Applications of Implicit Neural Representations (INRs) have emerged as a promising deep learning approach for compactly representing large volumetric datasets. These models can act as surrogates for volume data, enabling efficient storage and on-demand reconstruction via model predictions. However, conventional deterministic INRs only provide value predictions without insights into the model’s prediction uncertainty or the impact of inherent noisiness in the data. This limitation can lead to unreliable data interpretation and visualization due to prediction inaccuracies in the reconstructed volume. Identifying erroneous results extracted from model-predicted data may be infeasible, as raw data may be unavailable due to its large size. To address this challenge, we introduce REV-INR, Regularized Evidential Implicit Neural Representation, which learns to predict data values accurately along with the associated coordinate-level data uncertainty and model uncertainty using only a single forward pass of the trained REV-INR during inference. By comprehensively comparing and contrasting REV-INR with existing well-established deep uncertainty estimation methods, we show that REV-INR achieves the best volume reconstruction quality with robust data (aleatoric) and model (epistemic) uncertainty estimates using the fastest inference time. Consequently, we demonstrate that REV-INR facilitates assessment of the reliability and trustworthiness of the extracted isosurfaces and volume visualization results, enabling analyses to be solely driven by model-predicted data.
 STZ: A High Quality and High Speed Streaming Lossy Compression Framework for Scientific Data
D. Wang, P. Grosset, J. Pulido, J. Tian, T. M. Athawale, J. Jia, B. Sun, B. Zhang, S. Jin, K. Zhao, J. Ahrens, and F. Song
[Preprint (arXiv)] [BibTex] [Presentation slides] [Source code (C++)]
(Supercomputing 2025, St Louis, MO, USA)
Abstract
Error-bounded lossy compression is one of the most efficient solutions to reduce the volume of scientific data. For lossy compression, progressive decompression and random-access decompression are critical features that enable on-demand data access and flexible analysis workflows. However, these features can severely degrade compression quality and speed. To address these limitations, we propose a novel streaming compression framework that supports both progressive decompression and random-access decompression while maintaining high compression quality and speed. Our contributions are three-fold: (1) we design the first compression framework that simultaneously enables both progressive decompression and random-access decompression; (2) we introduce a hierarchical partitioning strategy to enable both streaming features, along with a hierarchical prediction mechanism that mitigates the impact of partitioning and achieves high compression quality—even comparable to state-of-the-art (SOTA) non-streaming compressor SZ3; and(3) our framework delivers high compression and decompression speed, up to 6.7× faster than SZ3.
 Stability-preserving Lossy Compression for Large-scale Partial Differential Equations
Q. Gong, M. Ainsworth, J. Chen, X. Liang, L. Zhu, E. Klasky, T. M. Athawale, Q. Liu, A. Rangarajan, S. Ranka, S. Klasky
[Preprint] [BibTex] [Presentation slides] [Source code (C++)]
(Supercomputing 2025, St Louis, MO, USA)
Abstract
Checkpoint/Restart (C/R) strategies are vital for fault tolerance in PDE-based scientific simulations, yet traditional checkpointing incurs significant I/O overhead. Lossy compression offers a scalable solution by reducing checkpoint data size, but conventional methods often lack control over physical invariants (e.g., energy), leading to instability such as oscillations or divergence in Partial Differential Equations (PDE) systems. This paper introduces a stability-preserving compression approach tailored for PDE simulations by explicitly controlling kinetic and potential energy perturbations to ensure stable restarts. Extensive experiments conducted across diverse PDE configurations demonstrate that our method maintains numerical stability with minimal error magnification---even across multiple checkpoint-restart cycles---outperforming state-of-the-art lossy compressors. Parallel evaluations on the Frontier supercomputer show up to 8.4× improvement in checkpoint write performance and 6.3× in read performance, while maintaining relative L2 errors ~2e-6 throughout continued simulation. These results provide practical guidance for balancing compression accuracy, stability, and computational efficiency in large-scale PDE applications.
 Visualization of Noisy and Less Noisy Computational Basis States in Quantum Computing
P. Senapati, Q. Guan, D. Pugmire, C.-C. Lu, and T. M. Athawale
[Paper] [BibTex] [Presentation slides] [Source code (Python)]
(IEEE QSW 2025, HelSinki, Finland)
Abstract
Quantum computing technology holds substantial promise as a reliable computational paradigm. However, current noisy intermediate scale quantum (NISQ) systems, are significantly impacted by noise originating from hardware inconsistencies. This noise causes errors and lowers output fidelity. So we must find which basis states cause errors. However, there are two main challenges in analyzing noise corresponding to basis states. First, the noise distribution data is high dimensional in nature, thereby making its analysis challenging. Second, although functional box plots have been used in the state of the art research to understand such a high dimensional data, they suffer from clutter and occlusion issues because of overplotting. In this study, we introduce an innovative visualization pipeline to address the aforementioned challenges to provide a clear depiction of noisy and less-noisy basis states. Specifically, our proposed visualization pipeline comprises three stages namely, low dimensional embedding, clustering, and violin plot visualization, to reduce visual clutter and effectively analyze high-dimensional noise distribution data. Our analysis uses quantum machine learning (QML) circuits as case study for drawing a distinction between noisy and less noisy basis states.
A High-Quality Workflow for Multi-Resolution Scientific Data Reduction and Visualization
D. Wang, P. Grosset, J. Pulido, T. M. Athawale, J. Tian, K. Zhao, Z. Lukic, A. Huebl, Z. Wang, J. Ahrens, and D. Tao
[Paper] [BibTex] [Presentation slides] [Source code (C++)]
(Supercomputing 2024, Atlanta, USA.)
Abstract
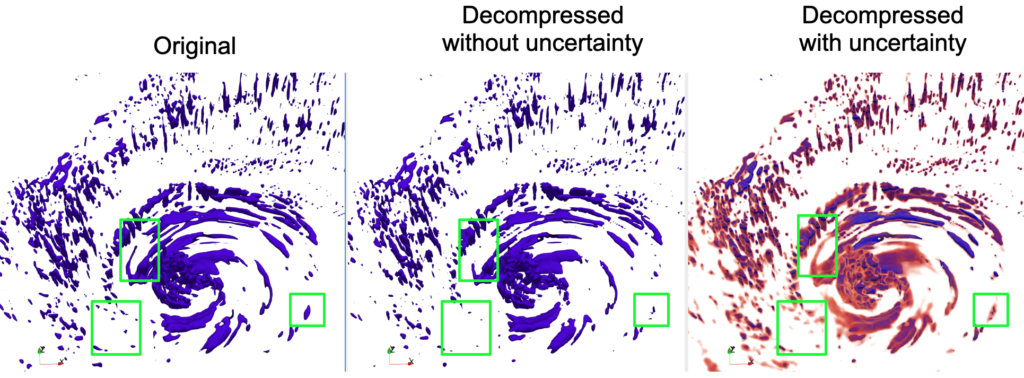
Multi-resolution methods such as Adaptive Mesh Refinement (AMR) can enhance storage efficiency for HPC applications generating vast volumes of data. However, their applicability is limited and cannot be universally deployed across all applications. Furthermore, integrating lossy compression with multi-resolution techniques to further boost storage efficiency encounters significant barriers. To this end, we introduce an innovative workflow that facilitates high-quality multi-resolution data compression for both uniform and AMR simulations. Initially, to extend the usability of multi-resolution techniques, our workflow employs a compression-oriented Region of Interest (ROI) extraction method, transforming uniform data into a multi-resolution format. Subsequently, to bridge the gap between multi-resolution techniques and lossy compressors, we optimize three distinct compressors, ensuring their optimal performance on multi-resolution data. Lastly, we incorporate an advanced uncertainty visualization method into our workflow to understand the potential impacts of lossy compression. Experimental evaluation demonstrates that our workflow achieves significant compression quality improvements.

A General Framework for Error-Controlled Unstructured Scientific Data Compression
Q. Gong, Z. Wang, V. Reshniak, X. Liang, J. Chen, Q. Liu, T. M. Athawale, Y. Ju, A. Rangarajan, S. Ranka, N. Podhorszki, R. Archibald, and S. Klasky
[Paper] [BibTex] [Presentation slides] [Source code (C++)]
(IEEE eScience 2024, Osaka, Japan.)
Abstract
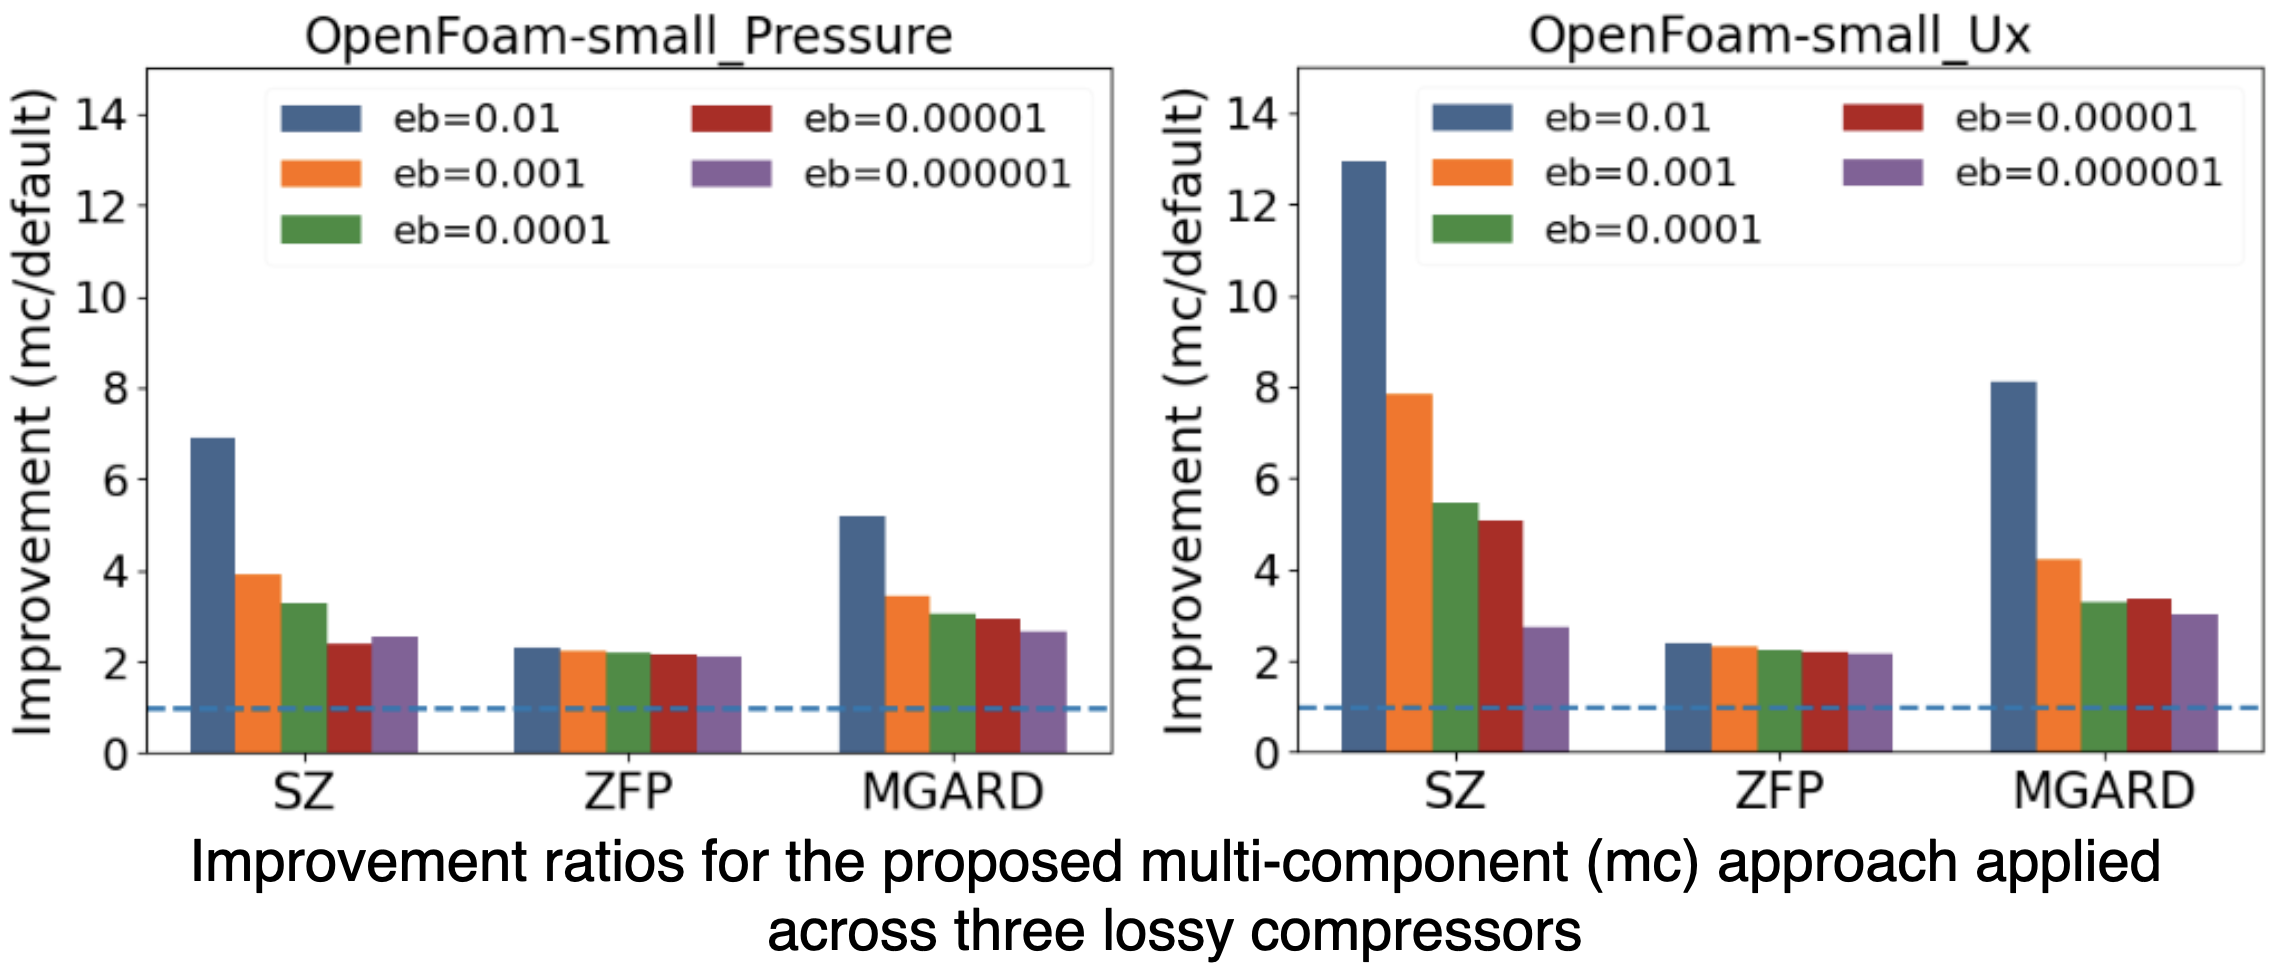
Data compression plays a key role in reducing storage and I/O costs. Traditional lossy methods primarily target data on rectilinear grids and cannot leverage the spatial coherence in unstructured mesh data, leading to suboptimal compression ratios. We present a multi-component, error-bounded compression framework designed to enhance the compression of floating-point unstructured mesh data, which is common in scientific applications. Our approach involves interpolating mesh data onto a rectilinear grid and then separately compressing the grid interpolation and the interpolation residuals. This method is general, independent of mesh types and typologies, and can be seamlessly integrated with existing lossy compressors for improved performance. We evaluated our framework across twelve variables from two synthetic datasets and two real-world simulation datasets. The results indicate that the multi-component framework consistently outperforms state-of-the-art lossy compressors on unstructured data, achieving, on average, a 2.3 − 3.5× improvement in compression ratios, with error bounds ranging from 1×10⁻⁶ to 1×10⁻². We further investigate the impact of hyperparameters, such as grid spacing and error allocation, to deliver optimal compression ratios in diverse datasets.
Data-Driven Computation of Probabilistic Marching Cubes for Efficient Level-Set Uncertainty Visualization
T. M. Athawale, Z. Wang, C. R. Johnson, and D. Pugmire
[Paper] [BibTex] [Presentation slides] [Source code (Viskores C++)]
(EuroVis 2024-Short Papers, Odense, Denmark.)
Abstract
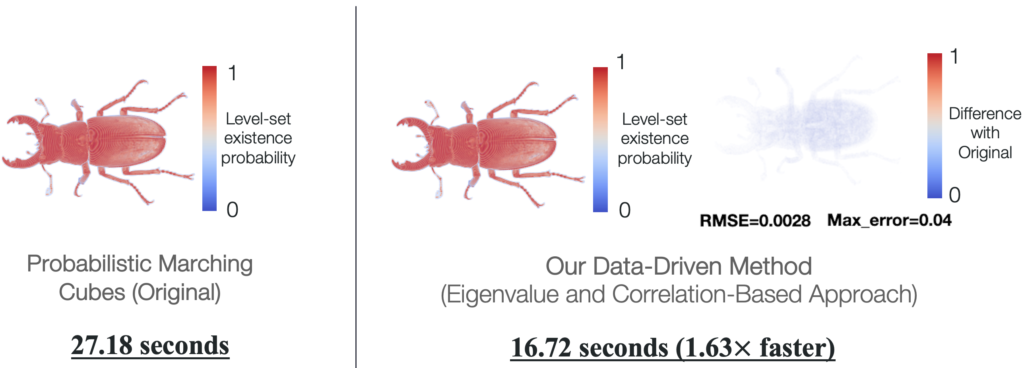
Uncertainty visualization is an important emerging research area. Being able to visualize data uncertainty can help scientists improve trust in analysis and decision-making. However, visualizing uncertainty can add computational overhead, which can hinder the efficiency of analysis. In this paper, we propose novel data-driven techniques to reduce the computational requirements of the probabilistic marching cubes (PMC) algorithm. PMC is an uncertainty visualization technique that studies how uncertainty in data affects level-set positions. However, the algorithm relies on expensive Monte Carlo (MC) sampling for the multivariate Gaussian uncertainty model because no closed-form solution exists for the integration of multivariate Gaussian. In this work, we propose the eigenvalue decomposition and adaptive probability model techniques that reduce the amount of MC sampling in the original PMC algorithm and hence speed up the computations. Our proposed methods produce results that show negligible differences compared with the original PMC algorithm demonstrated through metrics, including root mean squared error, maximum error, and difference images. We demonstrate the performance and accuracy evaluations of our data-driven methods through experiments on synthetic and real datasets.
 Accelerated Probabilistic Marching Cubes by Deep Learning for Time-Varying Scalar Ensembles
M. Han, T. M. Athawale, D. Pugmire, and C. R. Johnson
[Preprint (arXiv), Supplemental material] [BibTex] [Preview video] [Presentation video] [Presentation slides] [Source code (Python)]
(IEEE VIS 2022 conference, Oklahoma City, USA.)
Abstract
Visualizing the uncertainty of ensemble simulations is challenging
due to the large size and multivariate and temporal features of ensemble data sets. One popular approach to studying the uncertainty of ensembles is analyzing the positional uncertainty of the level sets. Probabilistic marching cubes is a technique that performs Monte Carlo sampling of multivariate Gaussian noise distributions for positional uncertainty visualization of level sets. However, the technique suffers from high computational time, making interactive visualization and analysis impossible to achieve. This paper introduces a deep-learning-based approach to learning the level-set uncertainty for two-dimensional ensemble data with a multivariate Gaussian noise assumption. We train the model using the first few time steps from time-varying ensemble data in our workflow. We demonstrate that our trained model accurately infers uncertainty in level sets for new time steps and is up to 170X faster than that of the original probabilistic model with serial computation and 10X faster than that of the original parallel computation.
 Uncertainty Visualization of the Marching Squares and Marching Cubes Topology Cases
T. M. Athawale, S. Sane, and C. R. Johnson
[Preprint (arXiv)] [BibTex] [Preview video] [Presentation slides] [Presentation Video] [Source code (Viskores C++)]
(IEEE VIS 2021, New Orleans, LA, USA (virtual).)
Abstract
Marching squares (MS) and marching cubes (MC) are widely used algorithms for level-set visualization of scientific data. In this paper, we address the challenge of uncertainty visualization of the topology cases of the MS and MC algorithms for uncertain scalar field data sampled on a uniform grid. The visualization of the MS and MC topology cases for uncertain data is challenging due to their exponential nature and a possibility of multiple topology cases per cell of a grid. We propose the topology case count and entropy-based techniques for quantifying uncertainty in the topology cases of the MS and MC algorithms when noise in data is modeled with probability distributions. We demonstrate the applicability of our techniques for independent and correlated uncertainty assumptions. We visualize the quantified topological uncertainty via color mapping proportional to uncertainty, as well as with interactive probability queries in the MS case and entropy isosurfaces in the MC case. We demonstrate the utility of our uncertainty quantification framework in identifying the isovalues exhibiting relatively high topological uncertainty. We illustrate the effectiveness of our techniques via results on synthetic, simulation, and hixel datasets.
 Visualization of Uncertain Multivariate Data via Feature Confidence Level-Sets
S. Sane, T. M. Athawale, and C. R. Johnson
[Preprint] [Bibtex] [Preview video] [Presentation slides] [Presentation video (talk# 3)]
(EuroVis 2021-23rd EG/VGTC Conference on Visualization, Zurich, Switzerland (virtual).)
Abstract
Recent advancements in multivariate data visualization have opened new research opportunities for the visualization community. In this paper, we propose an uncertain multivariate data visualization technique called feature confidence level-sets. Conceptually, feature level-sets refer to level-sets of multivariate data. Our proposed technique extends the existing idea of univariate confidence isosurfaces to multivariate feature level-sets. Feature confidence level-sets are computed by considering the trait for a specific feature, a confidence interval, and the distribution of data at each grid point in the domain. Using uncertain multivariate data sets, we demonstrate the utility of the technique to visualize regions with uncertainty in relation to the specific trait or feature, and the ability of the technique to provide secondary feature structure visualization based on uncertainty.
Deep brain stimulation (DBS) is an FDA-approved neurosurgical procedure for treating patients with movement disorders such as Parkinson's disease. Patient-specific computational modeling and visualization play a key role for efficient surgical and therapeutic decision-making relevant to DBS. The computational models analyze DBS post-operative brain imaging, e.g., computed tomography (CT), to understand the DBS electrode positions within the patient's brain. The DBS stimulation settings for optimal patient response depend upon a physician's knowledge regarding precise electrode positions. The finite resolution of brain imaging, however, restricts our understanding regarding precise DBS electrode positions. In our contribution, we study the problem of the quantification of positional uncertainty in the DBS electrodes caused by the finite resolution of post-operative imaging. We propose a Monte Carlo statistical framework, which takes the advantage of our analytical characterization of the DBS electrode geometry to understand the spatial uncertainty in DBS electrodes. Our statistical framework quantifies the uncertainty in two positional parameters of the DBS electrodes, namely, the longitudinal axis direction and the positions at sub-voxel levels. We interactively visualize quantified uncertainties by employing volume rendering and isosurfaces. We show that the spatial variations in the DBS electrode positions are significant for finite resolution imaging, and interactive visualization can be instrumental for efficient interpretation of the positional variations in the DBS lead.

 STZ: A High Quality and High Speed Streaming Lossy Compression Framework for Scientific Data
 Stability-preserving Lossy Compression for Large-scale Partial Differential Equations
 Visualization of Noisy and Less Noisy Computational Basis States in Quantum Computing

 Accelerated Probabilistic Marching Cubes by Deep Learning for Time-Varying Scalar Ensembles
 Uncertainty Visualization of the Marching Squares and Marching Cubes Topology Cases
 Visualization of Uncertain Multivariate Data via Feature Confidence Level-Sets