 Top Research Challenges and Opportunities for Near Real-Time Extreme-Scale Visualization of Scientific Data
D. Pugmire, K. Moreland, T. M. Athawale, J. Hammer, J. Huang
[Preprint]
(The 1st International Workshop on Near Real-Time Data Processing for Interconnected Scientific Instruments in conjunction with 2024 IEEE 20th International Conference on e-Science Osaka, Japan)
Abstract
The rapid advancement in scientific simulations and experimental facilities has resulted in the generation of vast amounts of data at unprecedented scales. The analysis and visualization of large amounts of data is a challenge in and of itself, but the requirements for timeliness significantly magnify these difficulties. Near real-time visualization is critical to monitor and analyze the data produced by these large facilities, but current production tools are not well-suited to these requirements. In this position paper, we share our perspective on some of the challenges, and thus, opportunities for research that stand in the way of near-real-time visualization of large scientific data.
 FunM²C: A Filter for Uncertainty Visualization of Multivariate Data on Multi-Core Devices
G. Hari, N. Joshi, Z. Wang, Q. Gong, D. Pugmire, K. Moreland, C. R. Johnson, S. Klasky, N. Podhorszki, and T. M. Athawale
[Preprint]
(2024 IEEE Workshop on Uncertainty Visualization: Applications, Techniques, Software, and Decision Frameworks [Best Paper Honorable Mention], St. Pete Beach, Florida, USA.)
Abstract
Uncertainty visualization is an emerging research topic in data visualization because neglecting uncertainty in visualization can lead to inaccurate assessments. In this paper, we study the propagation of multivariate data uncertainty in visualization. Although there have been a few advancements in probabilistic uncertainty visualization of multivariate data, three critical challenges remain to be addressed. First, the state-of-the-art probabilistic uncertainty visualization framework is limited to bivariate data (two variables). Second, existing uncertainty visualization algorithms use computationally intensive techniques and lack support for cross-platform portability. Third, as a consequence of the computational expense, integration into production visualization tools is impractical. In this work, we address all three issues and make a threefold contribution. First, we take a step to generalize the state-of-the-art probabilistic framework for bivariate data to multivariate data with an arbitrary number of variables. Second, through utilization of VTK-m's shared-memory parallelism and cross-platform compatibility features, we demonstrate acceleration of multivariate uncertainty visualization on different many-core architectures, including OpenMP and AMD GPUs. Third, we demonstrate the integration of our algorithms with the ParaView software. We demonstrate the utility of our algorithms through experiments on multivariate simulation data with three and four variables.
 Accelerated Depth Computation for Surface Boxplots with Deep Learning
M. Han, Tushar M. Athawale, J. Li, and C. R. Johnson
[Preprint]
(2024 IEEE Workshop on Uncertainty Visualization: Applications, Techniques, Software, and Decision Frameworks [Best Paper Honorable Mention], St. Pete Beach, Florida, USA.)
Abstract
Functional depth is a well-known technique used to derive descriptive statistics (e.g., median, quartiles, and outliers) for 1D data. Surface boxplots extend this concept to ensembles of images, helping scientists and users identify representative and outlier images. However, the computational time for surface boxplots increases cubically with the number of ensemble members, making it impractical for integration into visualization tools. In this paper, we propose a deep-learning solution for efficient depth prediction and computation of surface boxplots for time-varying ensemble data. Our deep learning framework accurately predicts member depths in a surface boxplot, achieving average speedups of 6X on a CPU and 15X on a GPU for the 2D Red Sea dataset with 50 ensemble members compared to the traditional depth computation algorithm. Our approach achieves at least a 99% level of rank preservation, with order flipping occurring only at pairs with extremely similar depth values that pose no statistical differences. This local flipping does not significantly impact the overall depth order of the ensemble members.
 Uncertainty-Informed Volume Visualization using Implicit Neural Representation
S. Saklani, C. Goel, S. Bansal, Z. Wang, S. Dutta, T. M. Athawale, D. Pugmire, and C. R. Johnson
[Preprint (arXiv)]
(2024 IEEE Workshop on Uncertainty Visualization: Applications, Techniques, Software, and Decision Frameworks, St. Pete Beach, Florida, USA.)
Abstract
The increasing adoption of Deep Neural Networks (DNNs) has led to their application in many challenging scientific visualization tasks. While advanced DNNs offer impressive generalization capabilities, understanding factors such as model prediction quality, robustness, and uncertainty is crucial. These insights can enable domain scientists to make informed decisions about their data. However, DNNs inherently lack ability to estimate prediction uncertainty, necessitating new research to construct robust uncertainty-aware visualization techniques tailored for various visualization tasks. In this work, we propose uncertainty-aware implicit neural representations to model scalar field data sets effectively and comprehensively study the efficacy and benefits of estimated uncertainty information for volume visualization tasks. We evaluate the effectiveness of two principled deep uncertainty estimation techniques: (1) Deep Ensemble and (2) Monte Carlo Dropout (MCDropout). These techniques enable uncertainty-informed volume visualization in scalar field data sets. Our extensive exploration across multiple data sets demonstrates that uncertainty-aware models produce informative volume visualization results. Moreover, integrating prediction uncertainty enhances the trustworthiness of our DNN model, making it suitable for robustly analyzing and visualizing real-world scientific volumetric data sets.
 Estimation and Visualization of Uncertainty from Linear and High-Order Interpolation Methods
T. A. J. Ouermi, J. Li, T. M. Athawale, and C. R. Johnson
[Preprint (arXiv)]
(2024 IEEE Workshop on Uncertainty Visualization: Applications, Techniques, Software, and Decision Frameworks, St. Pete Beach, Florida, USA.)
Abstract
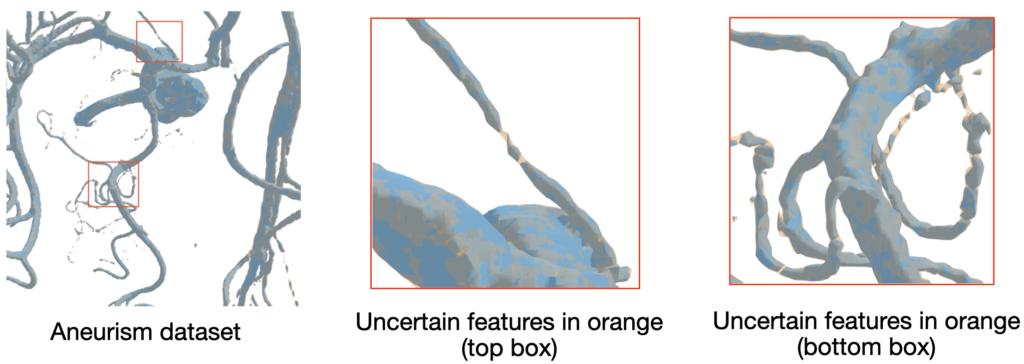
Isosurface visualization is fundamental for exploring and analyzing 3D volumetric data. Marching cubes (MC) algorithms with linear interpolation are commonly used for isosurface extraction and visualization. Although linear interpolation is easy to implement, it has limitations when the underlying data is complex and high-order, which is the case for most real-world data. Linear interpolation can output vertices at the wrong location. Its inability to deal with sharp features and features smaller than grid cells can lead to an incorrect isosurface with holes and broken pieces. Despite these limitations, isosurface visualizations typically do not include insight into the spatial location and the magnitude of these errors. We utilize high-order interpolation methods with MC algorithms and interactive visualization to highlight these uncertainties. Our visualization tool helps identify the regions of high interpolation errors. It also allows users to query local areas for details and compare the differences between isosurfaces from different interpolation methods. In addition, we employ high-order methods to identify and reconstruct possible features that linear methods cannot detect. We showcase how our visualization tool helps explore and understand the extracted isosurface errors through synthetic and real-world data.
 An Entropy-Based Test and Development Framework for Uncertainty Modeling in Level-Set Visualizations
R. Sisneros , T. M. Athawale, D. Pugmire, K. Moreland
[Preprint (arXiv)]
(2024 IEEE Workshop on Uncertainty Visualization: Applications, Techniques, Software, and Decision Frameworks, St. Pete Beach, Florida, USA.)
Abstract
We present a simple comparative framework for testing and developing uncertainty modeling in uncertain marching cubes implementations. The selection of a model to represent the probability distribution of uncertain values directly influences the memory use, run time, and accuracy of an uncertainty visualization algorithm. We use an entropy calculation directly on ensemble data to establish an expected result and then compare the entropy from various probability models, including uniform, Gaussian, histogram, and quantile models. Our results verify that models matching the distribution of the ensemble indeed match the entropy. We further show that fewer bins in nonparametric histogram models are more effective whereas large numbers of bins in quantile models approach data accuracy.
Performance Improvements of Poincare Analysis for Exascale Fusion Simulations
D. Pugmire, J. Y. Choi, S. Klasky, K. Moreland, E. Suchyta, T. M. Athawale, Z. Wang, C.-S. Chang, S.-H. Ku, and R. Hager
[Paper] [BibTex] [Presentation]
(VisGap 2024-The Gap Between Visualization Research and Visualization Software, Odense, Denmark.)
Abstract
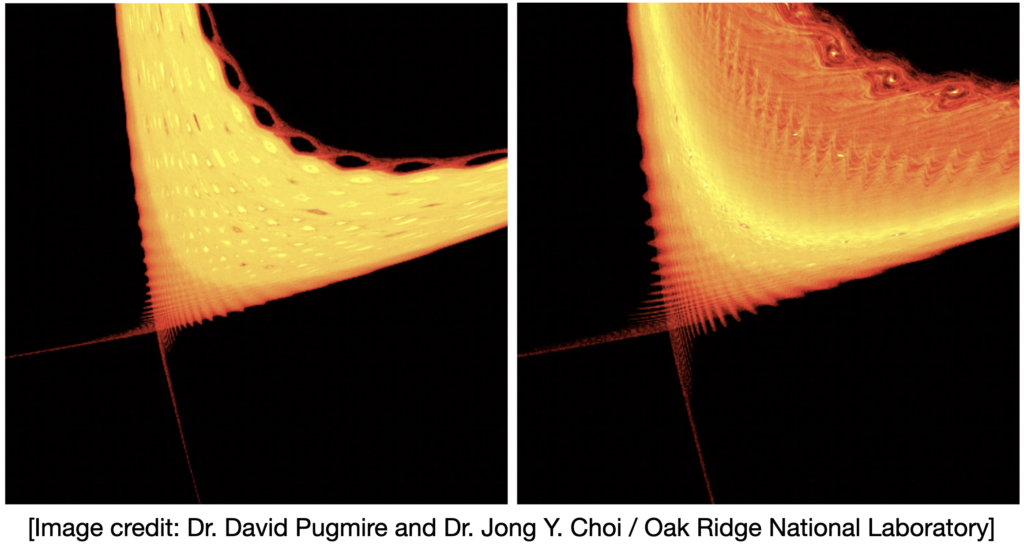
Understanding the time-varying magnetic field in a fusion device is critical for the successful design and construction of clean-burning fusion power plants. Poincaré analysis provides a powerful method for the visualization of magnetic fields in fusion devices. However, Poincaré plots can be very computationally expensive making it impractical, for example, to generate these plots in situ during a simulation. In this short paper, we describe a collaboration among computer science and physics researchers to develop a new Poincaré tool that provides a significant reduction in the time to generate analysis results.
 FunMC²: A Filter for Uncertainty Visualization of Marching Cubes On Multicore Devices
Z. Wang*, T. M. Athawale*, K. Moreland*, J. Chen, C. R. Johnson, and D. Pugmire
* The authors with equal contribution to the paper
[Paper] [BibTex] [Source code] [Presentation slides]
(Eurographics Symposium on Parallel Graphics and Visualization (EGPGV) workshop co-held with EuroVis 2023, Leipzig, Germany.)
Abstract
Visualization is an important tool for scientists to extract understanding from complex scientific data. Scientists need to understand the uncertainty inherent in all scientific data in order to interpret the data correctly. Uncertainty visualization has been an active and growing area of research to address this challenge. Algorithms for uncertainty visualization can be expensive, and research efforts have been focused mainly on structured grid types. Further, support for uncertainty visualization in production tools is limited. In this paper, we adapt an algorithm for computing key metrics for visualizing uncertainty in Marching Cubes (MC) to muti-core devices and present the design, implementation, and evaluation for a Filter for uncertainty visualization of Marching Cubes on Multi-Core devices (FunMC²). FunMC² accelerates the uncertainty visualization of MC significantly, and it is portable across multi-core CPUs and GPUs. Evaluation results show that FunMC² based on OpenMP runs around 11× to 41× faster on multi-core CPUs than the corresponding serial version using one CPU core. FunMC² based on a single GPU is around 5× to 9× faster than FunMC² running by OpenMP. Moreover, FunMC² is flexible enough to process ensemble data with both structured and unstructured mesh types. Furthermore, we demonstrate that FunMC² can be seamlessly integrated as a plugin into ParaView, a production visualization tool for post-processing.
 Advancing Comprehension of Quantum Application Outputs: A Visualization Technique
P. Senapati, T. M. Athawale, D. Pugmire, Q. Guan
[Paper] [Presentation slides]
(In ACM QCCC'2023 workshop co-located with High-Performance Distributed (HPDC) Conference, Orlando, FL, USA.)
Abstract
Noise in quantum computers presents a challenge for the users of quantum computing despite the rapid progress we have seen in the past few years in building quantum computers. Existing works have addressed the noise in quantum computers using a variety of
mitigation techniques since error correction requires a large number of qubits which is infeasible at present. One of the consequences of quantum computing noise is that users are unable to reproduce similar output from the same quantum computer at different times,
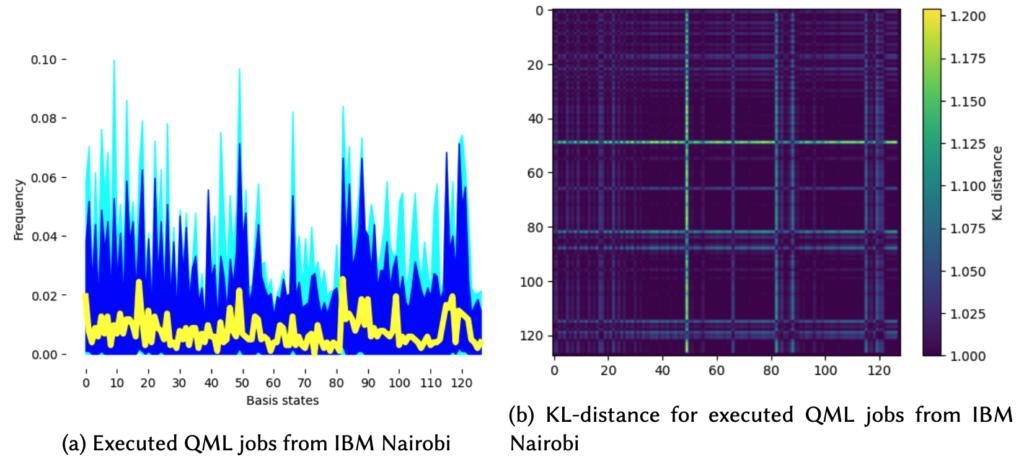
let alone from various quantum computers. In this work, we have made initial attempts to visualize quantum basis states for all the circuits that were used in quantum machine learning from various quantum computers and noise-free quantum simulators. We have opened up a pathway for further research into this field where we will be able to isolate noisy states from non-noisy states leading to efficient error mitigation. This is where our work provides an important step in the direction of efficient error mitigation. Our work also provides a ground for quantum noise visualization in the case of large numbers of qubits.
 Visualizing Interactions Between Solar Photovoltaic Farms and the Atmospheric Boundary Layer
T. M. Athawale*, B. Stanislawski*, S. Sane, and C. R. Johnson
* Both authors contributed equally to the paper
[Preprint] [BibTex] [Presentation slides] [Presentation video (at 24:50)]
(EnergyVis '21 workshop co-located with 12th ACM International Conference on Future Energy Systems (e-Energy' 21), June 28-July 2, 2021, Torino, Italy (virtual). ACM, New York, NY, USA, 5 pages, pp 377-381)
Abstract
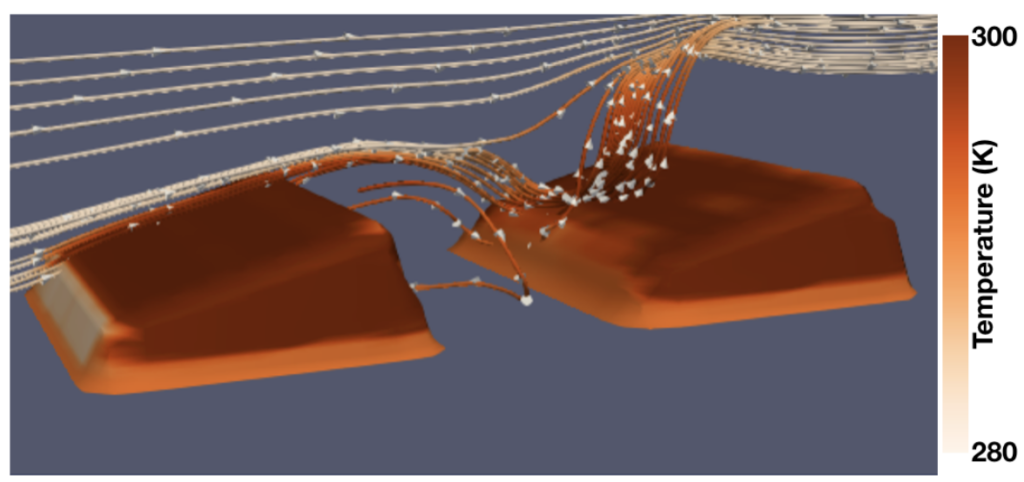
The efficiency of solar panels depends on the operating temperature. As the panel temperature rises, efficiency drops. Thus, the solar energy community aims to understand the factors that influence the operating temperature, which include wind speed, wind direction, turbulence, ambient temperature, mounting configuration, and solar cell material. We use high-resolution numerical simulations to model the flow and thermal behavior of idealized solar farms. Because these simulations model such complex behavior, advanced visualization techniques are needed to investigate and understand the results. Here, we present advanced 3D visualizations of numerical simulation results to illustrate the flow and heat transport in an idealized solar farm. The findings can be used to understand how flow behavior influences module temperatures, and vice versa.
A Statistical Framework for Visualization of Positional Uncertainty in Deep Brain Stimulation Electrodes
T. M. Athawale, K. A. Johnson, C. R. Butson, and C. R. Johnson
[arXiv] [Preprint] [Bibtex] [Poster] [Source code (MATLAB)]
(2019 IEEE Workshop on Visual Analytics in Healthcare (VAHC), Vancouver, BC, Canada, 2019, pp. 54-55.)
Abstract
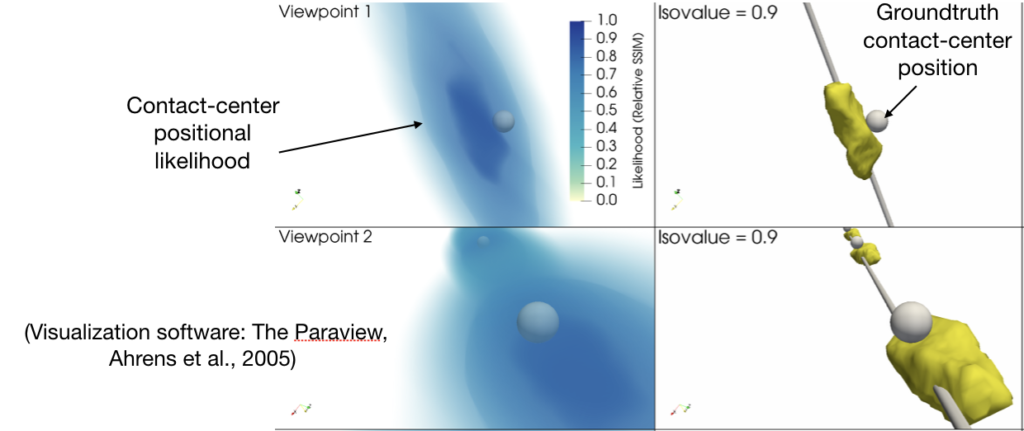
Deep brain stimulation (DBS) is an FDA-approved neurosurgical procedure for treating patients with movement disorders such as Parkinson's disease. Patient-specific computational modeling and visualization play a key role for efficient surgical and therapeutic decision-making relevant to DBS. The computational models analyze DBS post-operative brain imaging, e.g., computed tomography (CT), to understand the DBS electrode positions within the patient's brain. The DBS stimulation settings for optimal patient response depend upon a physician's knowledge regarding precise electrode positions. The finite resolution of brain imaging, however, restricts our understanding regarding precise DBS electrode positions. In our contribution, we study the problem of the quantification of positional uncertainty in the DBS electrodes caused by the finite resolution of post-operative imaging. We propose a Monte Carlo statistical framework, which takes the advantage of our analytical characterization of the DBS electrode geometry to understand the spatial uncertainty in DBS electrodes. Our statistical framework quantifies the uncertainty in two positional parameters of the DBS electrodes, namely, the longitudinal axis direction and the positions at sub-voxel levels. We interactively visualize quantified uncertainties by employing volume rendering and isosurfaces. We show that the spatial variations in the DBS electrode positions are significant for finite resolution imaging, and interactive visualization can be instrumental for efficient interpretation of the positional variations in the DBS lead.
 Investigating Multivariate, Vector, and Topological Data Analysis Techniques for Mantle Flow Pattern Visualization
S. Sane, T. M. Athawale, and C. R. Johnson
[Preprint] [Presentation video]
(accepted in the 2021 IEEE SciVis Contest (virtual).)
Abstract

Statistical Rendering for Visualization of Red Sea Eddy Simulation Data
T. M. Athawale, A. Entezari, B. Wang, and C. R. Johnson
[Preprint] [Poster (interactive)] [Preview video] [Presentation slides] [Presentation video (VIS 2020: SciVis Contest session, third from the last presentation)]
(Accepted in the 2020 IEEE SciVis Contest)
Abstract
Analyzing the effects of ocean eddies is important in oceanology for gaining insights into the transport of energy and biogeochemical particles. We present an application of statistical visualization techniques for the analysis of the Red Sea eddy simulation ensemble. Specifically, we demonstrate the applications of statistical volume rendering, statistical summary maps, and statistical level sets to velocity magnitude fields derived from the ensemble for the study of eddy positions. In statistical volume rendering, we model per-voxel data uncertainty using noise densities and study the propagation of uncertainty into the volume rendering pipeline. In the statistical summary maps, we characterize the uncertainty of gradient flow destinations to understand the structural variations of Morse complexes across the ensemble. In statistical level sets, we study the effects on isocontour positions for the Gaussian-distributed uncertainty. We demonstrate the utility of our statistical visualizations for the analysis of eddy positions and their spatial uncertainty, as well as for the exploration of the correlation between temperature and velocity magnitude fields and the study of water surface elevation data.
Deep brain stimulation (DBS) is an FDA-approved neurosurgical procedure for treating patients with movement disorders such as Parkinson's disease. Patient-specific computational modeling and visualization play a key role for efficient surgical and therapeutic decision-making relevant to DBS. The computational models analyze DBS post-operative brain imaging, e.g., computed tomography (CT), to understand the DBS electrode positions within the patient's brain. The DBS stimulation settings for optimal patient response depend upon a physician's knowledge regarding precise electrode positions. The finite resolution of brain imaging, however, restricts our understanding regarding precise DBS electrode positions. In our contribution, we study the problem of the quantification of positional uncertainty in the DBS electrodes caused by the finite resolution of post-operative imaging. We propose a Monte Carlo statistical framework, which takes the advantage of our analytical characterization of the DBS electrode geometry to understand the spatial uncertainty in DBS electrodes. Our statistical framework quantifies the uncertainty in two positional parameters of the DBS electrodes, namely, the longitudinal axis direction and the positions at sub-voxel levels. We interactively visualize quantified uncertainties by employing volume rendering and isosurfaces. We show that the spatial variations in the DBS electrode positions are significant for finite resolution imaging, and interactive visualization can be instrumental for efficient interpretation of the positional variations in the DBS lead.
 Top Research Challenges and Opportunities for Near Real-Time Extreme-Scale Visualization of Scientific Data
 FunM²C: A Filter for Uncertainty Visualization of Multivariate Data on Multi-Core Devices
 Accelerated Depth Computation for Surface Boxplots with Deep Learning
 Uncertainty-Informed Volume Visualization using Implicit Neural Representation
 Estimation and Visualization of Uncertainty from Linear and High-Order Interpolation Methods
 An Entropy-Based Test and Development Framework for Uncertainty Modeling in Level-Set Visualizations
 FunMC²: A Filter for Uncertainty Visualization of Marching Cubes On Multicore Devices
 Advancing Comprehension of Quantum Application Outputs: A Visualization Technique
  Visualizing Interactions Between Solar Photovoltaic Farms and the Atmospheric Boundary Layer
 Investigating Multivariate, Vector, and Topological Data Analysis Techniques for Mantle Flow Pattern Visualization


