Dr. Tushar Athawale is a Research Scientist in the Visualization Group at Oak Ridge National Laboratory. He holds the position of Joint Faculty Assistant Professor in Electrical Engineering and Computer Science (EECS) Department of the University of Tennessee, Knoxville. He received MS and Ph.D. degrees in computer science from the University of Florida in 2014 and 2015, respectively. He specializes in uncertainty visualization, and his other research interests include large-scale visualization, statistical and topological data analysis, and high-performance computing.
Postdoctoral Fellow
Dr. Timbwaoga A. J. Ouermi is a postdoctoral fellow at the Oak Ridge National Laboratory. Previously, he was postdoctoral research associate at the scientific computing and imaging SCI institute under the mentorship of Prof. Chris Johnson. He received his bachelor's degree in Physics and Computer Science from the University of Oregon in 2016 and his Ph.D. in Computing from the University of Utah in 2022. He was advised by Prof. Martin Berzins and Prof. Mike Kirby for his Ph.D. dissertation and by Prof. Hank Child for his undergraduate thesis.
Undergraduate Intern
Alex Gorczowski is a student research intern at Oak Ridge National Laboratory under the mentorship of Dr. Tushar Athawale. He is an undergraduate student at the University of Illinois Urbana-Champaign pursuing a B.S. in Computer Science and Statistics. His interests center on high-performance computing, GPU acceleration, scientific computing, data science, and machine learning. He also conducts research with the DISSCO Research Group at the National Center for Supercomputing Applications and has prior research experience at Argonne National Laboratory.
In this paper, we study the propagation of data uncertainty through the marching cubes algorithm for isosurface visualization for correlated uncertain data. Consideration of correlation has been shown paramount for avoiding errors in uncertainty quantification and visualization in multiple prior studies. Although the problem of isosurface uncertainty with spatial data correlation has been previously addressed, there are two major limitations to prior treatments. First, there are no analytical formulations for uncertainty quantification of isosurfaces when the data uncertainty is characterized by a Gaussian distribution with spatial correlation. Second, as a consequence of the lack of analytical formulations, existing techniques resort to a Monte Carlo sampling approach, which is expensive and difficult to integrate into visualization tools. To address these limitations, we present a closed-form framework to efficiently derive uncertainty in marching cubes level-sets for Gaussian uncertain data with spatial correlation (MAGIC). To derive closed-form solutions, we leverage the Hinkley’s derivation on the ratio of Gaussian distributions. With our analytical framework, we achieve a significant speed-up and enhanced accuracy of uncertainty quantification over classical Monte Carlo methods. We further accelerate our analytical solutions using many-core processors to achieve speed-ups up to 585× and integrability with production visualization tools for broader impact. We demonstrate the effectiveness of our correlation-aware uncertainty framework through experiments on meteorology, urban flow, and astrophysics simulation datasets.
We present a generalizable uncertainty quantification (UQ) and visualization framework for lattice Boltzmann method simulations of high Reynolds number vascular flows, demonstrated on a patient-specific stenosed aorta. The framework combines EasyVVUQ for parameter sampling with large-eddy simulation turbulence modeling in HemeLB, and executes ensembles on the Frontier exascale supercomputer. Spatially resolved metrics, including entropy and isosurface-crossing probability, are used to map uncertainty in pressure and wall shear stress fields directly onto vascular geometries. Two sources of model variability are examined: inlet peak velocity and the Smagorinsky constant. Inlet velocity variation produces high uncertainty downstream of the stenosis where turbulence develops, while upstream regions remain stable. Smagorinsky constant variation has little effect on the large-scale pressure field but increases WSS uncertainty in localized high-shear regions. In both cases, the stenotic throat manifests low entropy, indicative of robust identification of elevated WSS. By linking quantitative UQ measures to three-dimensional anatomy, the framework improves interpretability over conventional 1D UQ plots and supports clinically relevant decision-making, with broad applicability to vascular flow problems requiring both accuracy and spatial insight.
Applications of Implicit Neural Representations (INRs) have emerged as a promising deep learning approach for compactly representing large volumetric datasets. These models can act as surrogates for volume data, enabling efficient storage and on-demand reconstruction via model predictions. However, conventional deterministic INRs only provide value predictions without insights into the model’s prediction uncertainty or the impact of inherent noisiness in the data. This limitation can lead to unreliable data interpretation and visualization due to prediction inaccuracies in the reconstructed volume. Identifying erroneous results extracted from model-predicted data may be infeasible, as raw data may be unavailable due to its large size. To address this challenge, we introduce REV-INR, Regularized Evidential Implicit Neural Representation, which learns to predict data values accurately along with the associated coordinate-level data uncertainty and model uncertainty using only a single forward pass of the trained REV-INR during inference. By comprehensively comparing and contrasting REV-INR with existing well-established deep uncertainty estimation methods, we show that REV-INR achieves the best volume reconstruction quality with robust data (aleatoric) and model (epistemic) uncertainty estimates using the fastest inference time. Consequently, we demonstrate that REV-INR facilitates assessment of the reliability and trustworthiness of the extracted isosurfaces and volume visualization results, enabling analyses to be solely driven by model-predicted data.
Viskores is a scientific visualization library that is the primary deployment of such algorithms to the parallel accelerated processors of modern DOE supercomputers. In this paper, we review the capabilities provided by Viskores and how these capabilities are leveraged by other software in the high-performance computing ecosystem. We discuss the Viskores data representation and pay particular attention to array management. Through this array management we describe how data is adapted between Viskores and other software along with strategies for converting dynamic, polymorphic objects to static representations better suited to GPU processing. We conclude with several examples of Viskores integrating with high-performance software that is used in production today
Presentations and Posters
2026:
Poster presentation at 2026 DOE CS PI Meeting, Rockville, DC, July 2026 (to be presented)
VisTrust: Uncertainty Visualization for Trusted Scientific Discovery and Analysis [Poster]
Paper presentation at VisGap'26, Nottingham, UK, June 2026
Viskores: Integrating Parallel Scientific Visualization Research into Application [Presentation slides]
Paper presentation at 2026 IEEE PacificVis, Sydney, Australia, April 2026
REV-INR: Regularized Evidential Implicit Neural Representation for Uncertainty-Aware Volume Visualization [Presentation slides]
Deep brain stimulation (DBS) is an FDA-approved neurosurgical procedure for treating patients with movement disorders such as Parkinson's disease. Patient-specific computational modeling and visualization play a key role for efficient surgical and therapeutic decision-making relevant to DBS. The computational models analyze DBS post-operative brain imaging, e.g., computed tomography (CT), to understand the DBS electrode positions within the patient's brain. The DBS stimulation settings for optimal patient response depend upon a physician's knowledge regarding precise electrode positions. The finite resolution of brain imaging, however, restricts our understanding regarding precise DBS electrode positions. In our contribution, we study the problem of the quantification of positional uncertainty in the DBS electrodes caused by the finite resolution of post-operative imaging. We propose a Monte Carlo statistical framework, which takes the advantage of our analytical characterization of the DBS electrode geometry to understand the spatial uncertainty in DBS electrodes. Our statistical framework quantifies the uncertainty in two positional parameters of the DBS electrodes, namely, the longitudinal axis direction and the positions at sub-voxel levels. We interactively visualize quantified uncertainties by employing volume rendering and isosurfaces. We show that the spatial variations in the DBS electrode positions are significant for finite resolution imaging, and interactive visualization can be instrumental for efficient interpretation of the positional variations in the DBS lead.



 MAGIC: Marching Cubes Isosurface Uncertainty Visualization for Gaussian Uncertain Data with Spatial Correlation
 An Uncertainty Visualization Framework for Large-Scale Cardiovascular Flow Simulations: A Case Study on Aortic Stenosis
 REV-INR: Regularized Evidential Implicit Neural Representation for Uncertainty-Aware Volume Visualization
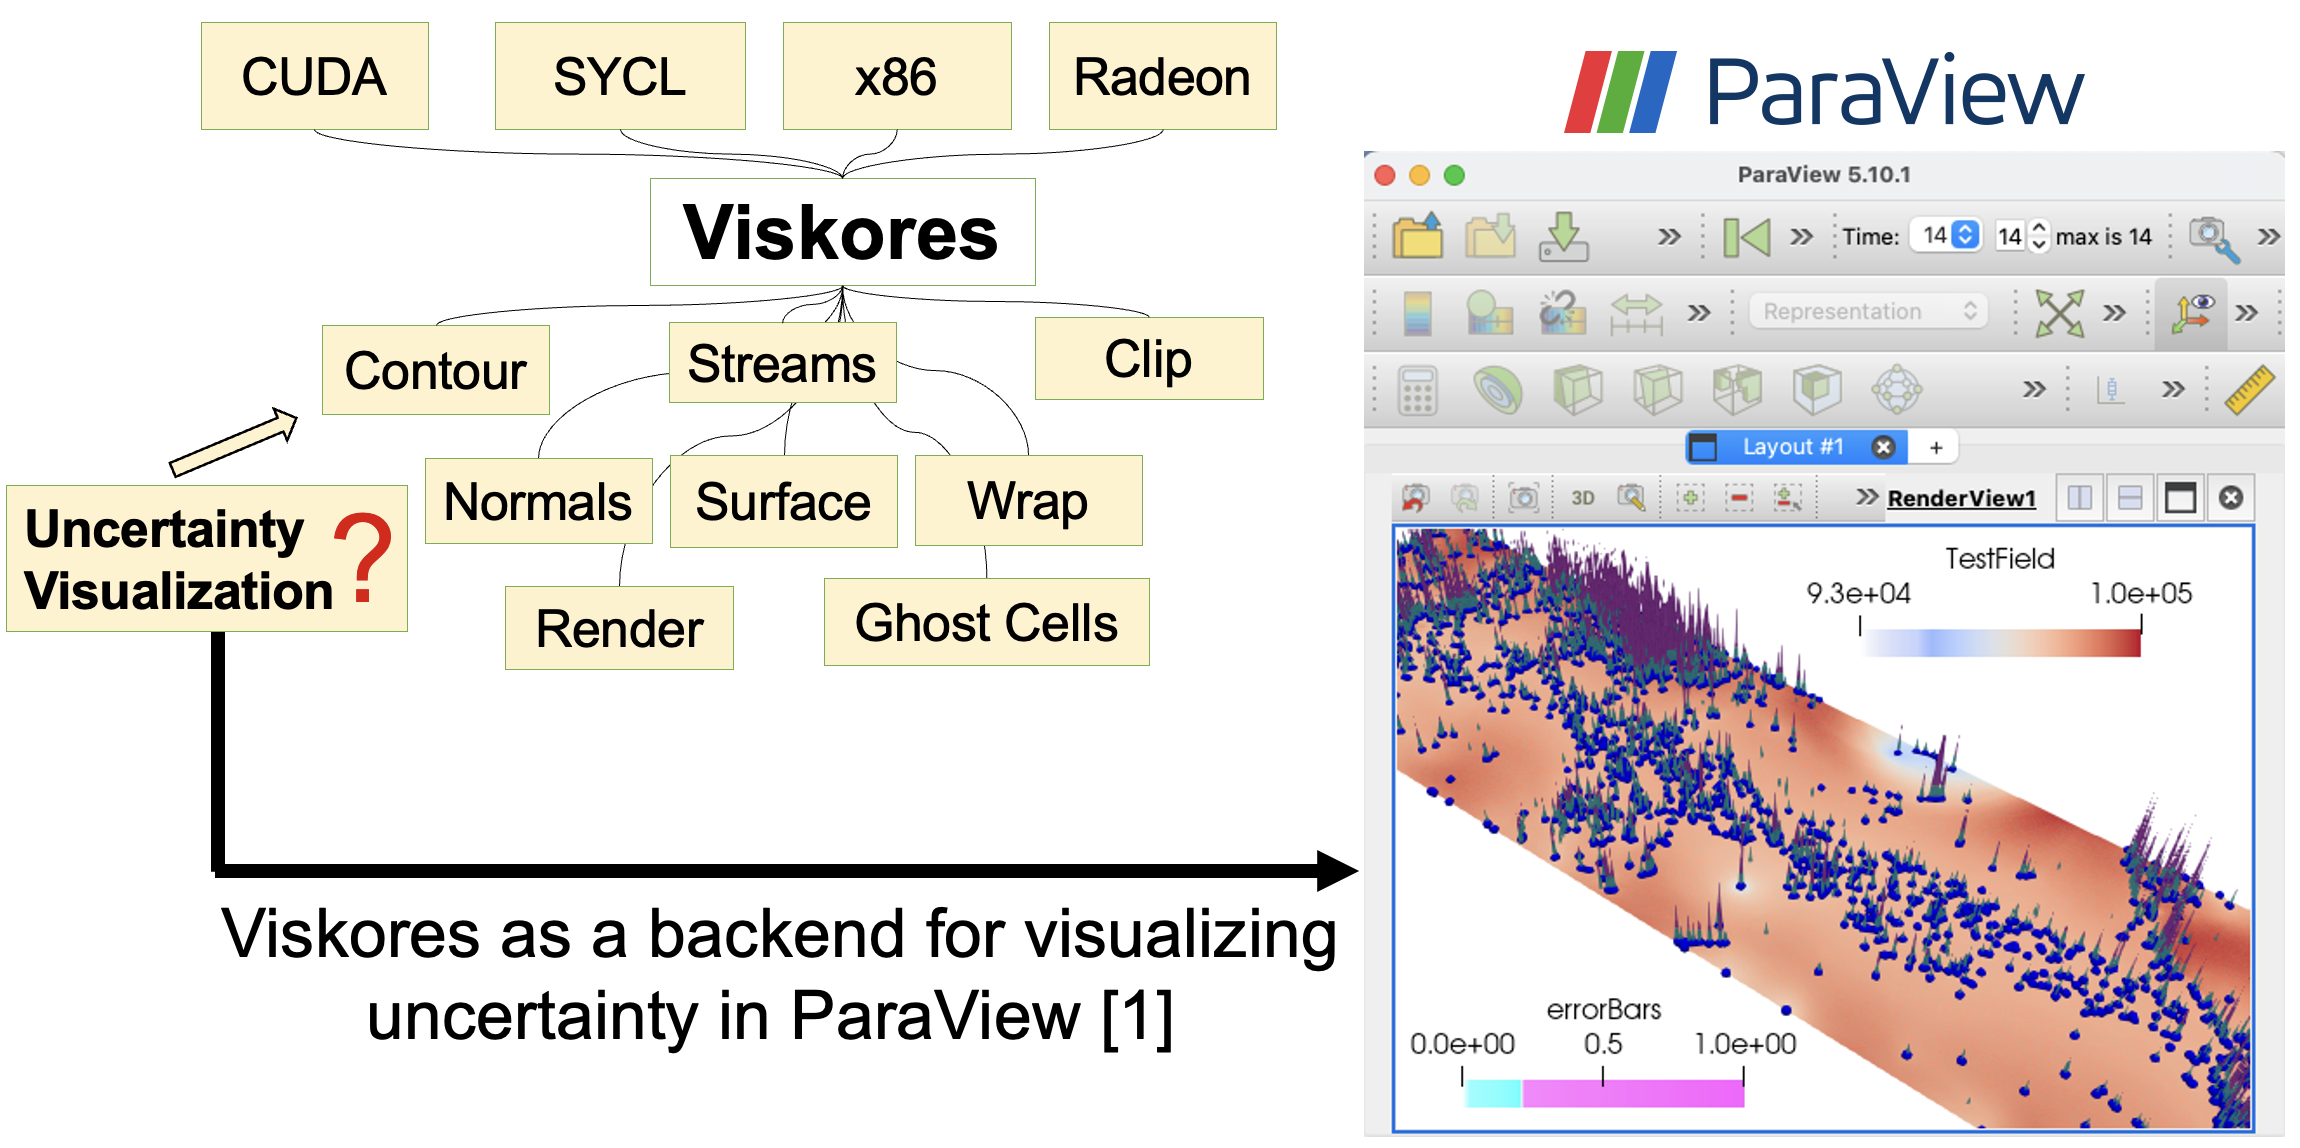 Viskores: Integrating Parallel Scientific Visualization Research into Applications